
Created by: FxsuccessBD | 0
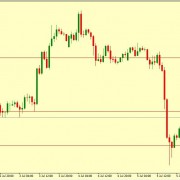
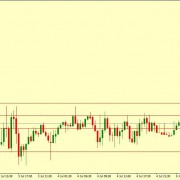
According to daily NZDUSD chart this pair already took 50% Fibonacci retracement (highlighted yellow line). We saw that during Friday NFP this pair took bearish breakout and move towards 0.66 levels where dynamic support & EMA 50 level have. Now price trying to take upside correction and expected target zone is 0.668 and it can be a logical pullback zone. Suggestion: Wait and go for short position from 0.668 level and ideal target can be 0.66 levels. DAILY PIVOT: Check Chart for Exact PIVOT Price Level.
Created by: FxsuccessBD | 0
AUD/USD one more dip to 0.6969 is expected followed by a grind higher to 0.7020. Following which it can continue its downtrend. Ex-High: 0.7029 Ex-Low: 0.6957 Supports and Resistance levels: Support 1: 0.6949 Supports 2: 0.6917 Resistance 1: 0.7020 Resistances 2: 0.7060 Pivot: 0.6989
Created by: FxsuccessBD | 0
EUR/USD looks set to visit lower territory down to about 1.1217 - 1.1193. Its corrective attempts must fail ahead of 1.1257 - 1.1273. Stop loss beyond 1.1321 regions. Ex-High: 1.1288 Ex-Low: 1.1207 Supports and Resistance levels: Support 1: 1.1193 Supports 2: 1.1160 Resistance 1: 1.1273 Resistances 2: 1.1321 Pivot: 1.1240
Created by: FxsuccessBD | 0
GBP/USD formation suggests that it might fall to 1.2566 whereas below 1.2586 regions. A rise above 1.2593 regions is bullish. Ex-High: 1.2591 Ex-Low: 1.2665 Supports and Resistance levels: Support 1: 1.2566 Supports 2: 1.2552 Resistance 1: 1.2593 Resistances 2: 1.2605 Pivot: 1.2579
Created by: FxsuccessBD | 0
EUR/USD looks set for gains to 1.1296. A Supports at 1.1279 and 1.1274 regions. A break of 1.1262 will damage this bullish formation. Ex-High: 1.1295 Ex-Low: 1.1273 Supports and Resistance levels: Support 1: 1.1274 Supports 2: 1.1262 Resistance 1: 1.1296 Resistances 2: 1.1306 Pivot: 1.1284
Created by: FxsuccessBD | 0
EUR/USD turn down should be supported around 1.1218 regions for rally to above 1.1303. An apparent break of 1.1218 will spoil this accepted rally. Ex-High: 1.1311 Ex-Low: 1.1269 Supports and Resistance levels: Support 1: 1.1260 Supports 2: 1.1243 Resistance 1: 1.1303 Resistances 2: 1.1328 Pivot: 1.1286
Created by: FxsuccessBD | 0
GBP/USD might rally resistance in 1.2572 - 1.2577 regions for a flow down to 1.2553 regions, following which bounce to 1.2596 is likely. Ex-High: 1.2601 Ex-Low: 1.2557 Supports and Resistance levels: Support 1: 1.2553 Supports 2: 1.2533 Resistance 1: 1.2596 Resistances 2: 1.2620 Pivot: 1.2577
Created by: FxsuccessBD | 0
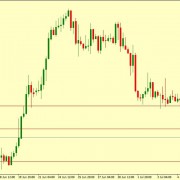
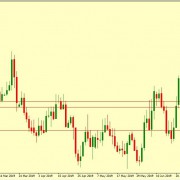
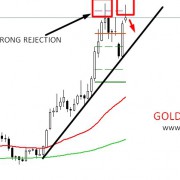
GOLD GONNA TAKE A SHORT BREAK: According to daily chart Gold now trying to form DOUBLE TOP chart pattern whereas the key resistance is 1436 level. Few days back this pair took gap starting at 1393 Level and started bearish momuntum but its fill up the Gap successfully and regain its bullish rally todards 1436 level. But its still unable to break the key resistance. Our Suggestions: We prefer short position from key resistance level at 1436 level and logical target can be 1406 level. PIVOT at a Glance: R3: 1468.95, R2: 144.88, R1: 1431.40, PIVOT1407.33, S1: 1393.85, S2: 1369.78, S3: 1356.30
Created by: FxsuccessBD | 0
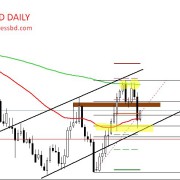
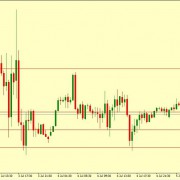
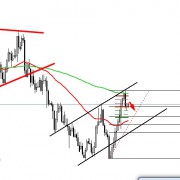
NZDUSD DAILY MARKET ANALYSIS: NZDUSD currently just above the daily pivot level 0.66690. 2 days back this pair hit the daily strong 200 EMA and took strong resistance zone. From this zone this pair starts taking downside correction and form a strong bearish engulfing candle pattern which actually indicate further falling momentum. According to fundamental view this pair also turns to bearish momentum as USA showing its strong trend. So we suggest to stay with SHORT TRADE and target can be 0.66 level where have Fibonacci 0.50 level. PIVOT at a Glance: R3: 0.67069, R2: 0.66941, R1: 0.66818, PIVOT: 0.66690, S1: 0.66567, S2: 0.66439, S3: 0.66316

EUR/USD uptrend is quiet intact in a triangle configuration. It must carry on to rally to 1.0748 or 1.0778 if support around 1.0689 hold. Ex-High: 1.0748 Ex-Low: 1.0671 &nbs

EUR/USD uptrend is quiet intact in a triangle configuration. It must carry on to rally to 1.0765 or 1.0789 if support around 1.0719 hold. Ex-High: 1.0765 Ex-Low: 1.0704 &n

EUR/USD uptrend is quiet intact in a triangle configuration. It must carry on to rally to 1.0715 or 1.0739 if support around 1.0653 hold. Ex-High: 1.0739 Ex-Low: 1.0626 &nbs

EUR/USD uptrend is quiet intact in a triangle configuration. It must carry on to rally to 1.0757 or 1.0778 if support around 1.0702 hold. Ex-High: 1.0778 Ex-Low: 1.0678 &nbs

EUR/USD uptrend is quiet intact in a triangle configuration. It must carry on to rally to 1.0774 or 1.0787 if support around 1.0724 hold. Ex-High: 1.0787 Ex-Low: 1.0724 &nbs